Monitoring
This section is Docker specific
The SmartFace Installation can be monitored in via several ways:
- metrics
- tracing
- reading logs
Metrics
The most of the services propagate their metrics, than can be read and observed and used as a trigger to a further maintenance event.
To use the metrics, you can:
- read metrics of services directly
- use an automatized observability system
Reading Metrics Manually
The services that provide metrics provide them on port 4318 in the docker installations. To read them manually you need to adjust your docker-compose.yml file for such services to propagate the metrics outside. Each service should provide a standalone port for it’s metrics, so it is reachable from the outside.
For the example below, the inner port 4318 was propagated outside of the container using port 4323. Another camera, such as camera sf-cam-4 can use another port, such as 4324.
  sf-cam-3:
    image: ${REGISTRY}sf-cam:${SF_VERSION}
    container_name: SFCam3
    command: --serviceName SFCam3
    ports:
      - 30003:${CameraDefaults__PreviewPort}
      - 4323:4318
    restart: unless-stopped
Once the port is propagated and the changes are applied, you can visit your camera’s metrics at the metrics endpoint at your service’s port.
An example URL:
http://localhost:4323/metrics
Tracing
The SmartFace Platform does provide tracing, allowing you to trace events and steps being performed during platform processes. This includes API calls, such as the REST API calls. Jaeger is being used as the tracing engine.
Configure tracing
By default it is turned off. To turn it on you need to change configuration USE_JAEGER_APP_SETTINGS
Windows
Set Windows Environment Variable with Variable name AppSettings__USE_JAEGER_APP_SETTINGS and Variable value true.
When reporting to different machine set JAEGER_AGENT_HOST and Variable value ip-of-your-machine-with-jaeger

Linux
On Docker open .env and update variables
AppSettings__USE_JAEGER_APP_SETTINGS=true
...
JAEGER_AGENT_HOST=jaeger
jaeger is the container shipped in our docker samples. Similair to Windows configuration feel free to update to other machine or endpoint that runs Jaeger.
Once the configuration is updated you need to apply changes. Once the Jaeger tracing is allowed you can visit the web interface on the port 16686 (such as on the URL http://localhost:16686.
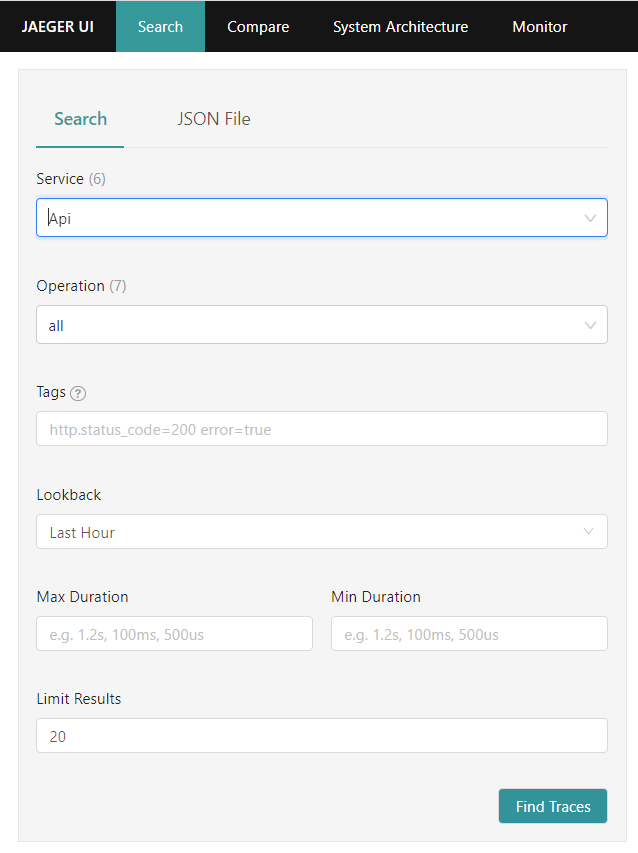
On the main page of the web interface you can use the Search function to find tracings you are interested in.
Search in tracing
Once you find a tracing you are interested in you can click on the tracing to get more information.
Search results
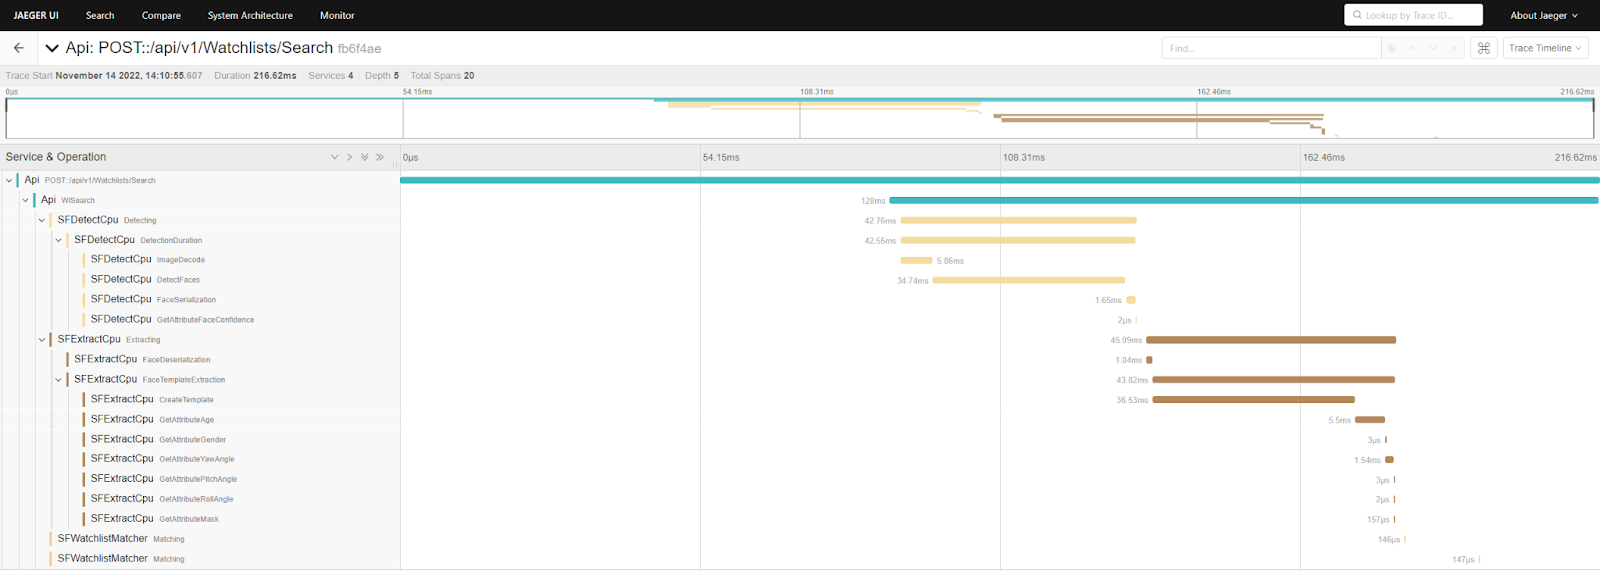
More detailed information is provided including each step and how long it takes to perform the step.
Detailed information
More information about Jaeger tracing can be found at https://www.jaegertracing.io/
Log files
Reading Log files
Each container creates its own logs during its lifetime. You can access them in real time if needed. To do so you need to know the name of the container you are after.
To find out the list of containers and their names you can use this command:
sudo docker ps -a
You get such result as below:
user@password:/srv/smartface $ docker ps -a
CONTAINER ID   IMAGE                                                COMMAND                  CREATED       STATUS        PORTS
87518ea0f03e   registry.gitlab.com/innovatrics/smartface/sf-api:v5_4.22.0        "dotnet SmartFace.Ap…"   3 hours ago   Up 3 hours   0.0.0.0:8098->80/tcp, :::8098->80/tcp   SFApi
d5fbc111d7ab   registry.gitlab.com/innovatrics/smartface/sf-cam:v5_4.22.0        "dotnet SmartFace.Ca…"   3 hours ago   Up 3 hours   0.0.0.0:30003->30000/tcp, :::30003->30000/tcp   SFCam3
d7542eb5bbb2   registry.gitlab.com/innovatrics/smartface/sf-graphql-api:v5_4.22.0   "dotnet SmartFace.Gr…"   3 hours ago   Up 3 hours   0.0.0.0:8097->80/tcp, :::8097->80/tcp   SFGraphQLApi
73a474ba1a76   registry.gitlab.com/innovatrics/smartface/sf-base:v5_4.22.0   "dotnet SmartFace.dl…"   3 hours ago   Up 3 hours   0.0.0.0:2406->2406/tcp, :::2406->2406/tcp   SFBase
b96c758a4c45   registry.gitlab.com/innovatrics/smartface/sf-cam:v5_4.22.0   "dotnet SmartFace.Ca…"   3 hours ago   Up 3 hours   0.0.0.0:30002->30000/tcp, :::30002->30000/tcp   SFCam2
7970ab7bece9   registry.gitlab.com/innovatrics/smartface/sf-access-controller:v5_1.9.1   "dotnet SmartFace.Ac…"   3 hours ago   Up 3 hours   0.0.0.0:5050->80/tcp, :::5050->80/tcp   SFAccessController
c812bd168f96   registry.gitlab.com/innovatrics/smartface/sf-station:v5_1.20.0   "docker-entrypoint.s…"   3 hours ago   Up 3 hours   0.0.0.0:8000->8000/tcp, :::8000->8000/tcp   SFStation
You now know the names of the services: SFApi, SFCam3, SFGraphQLApi, SFBase, SFCam2, SFAccessController, SFStation etc.
Once you have a container name you would like to know more about you can invoke the logs by command:
sudo docker logs <ContainerName>
To allow logs to be continuously fed to your screen, please use additional parameter -f, such as:
sudo docker logs <ContainerName> -f
To see a continuous logs of events as they happen across the whole setup at once (useful for real time debugging), you can run command below in the folder where the docker-compose.yml file is located:
sudo docker-compose logs --tail=0 -f
All the logs can be scraped and organized into a central log system such as Grafana Loki within a customized setup and deployment.
Logs Maintenance
In a system that runs for a while the amount of logs can actually take a significant amount of the server’s storage space. To list the existing docker logs and size they occupy on a hard drive, please run the command below:
sudo du -h $(docker inspect --format='{{.LogPath}}' $(docker ps -qa))
It is possible the amount of data kept in the logs might be substantial on your SmartFace installation it would be reasonable to limit the amount of logs to be stored. You can limit the maximum size of a log and the amount of logs to be stored by adjusting the docker-compose.yml file. Add and adjust the logging section for each container as per snippet below.
api:
    image: ${REGISTRY}sf-api:${SF_VERSION}
    logging:
        driver: "json-file"
        options:
            max-file: 5
            max-size: 10m


